Occupy Wallstreet – by Lemony Snicket
I’ll just post this here for you: http://occupywriters.com/by-lemony-snicket
Occupy Wallstreet – by Lemony Snicket
I’ll just post this here for you: http://occupywriters.com/by-lemony-snicket
American Prosperity Charts
In response to the multitude of questions about what the Occupy Wallstreet people are about, Business Insider put together a very interesting set of charts.
Full article can be found here: http://www.businessinsider.com/what-wall-street-protesters-are-so-angry-about-2011-10?op=1
Occupy Portland Analysis
There seems to be a lot of misconception about what the Occupy Portland protests are about. People are deriding the protesters, without really knowing who they are. They merely complain about the how it’s going to affect the commute home. The entire Occupy Wallstreet movement’s lack of clear goals is hurting them in the press.
But the protestors are not “snot nosed kids,” “hippies,” “welfare scum,” or “homeless unemployed.” The average age is low 30’s. A lot have homes. Many have jobs. Many have been recently unemployed or are fearful of their jobs being cut. Many no longer have savings or a 401k plan. They come from a multitude of backgrounds, truck drivers, teachers, doctors, lawyers, warehouse clerks, etc. They come from ALL political parties, but are heavily represented by the Swing Voters that both parties try so hard to court. Many are recent college graduates who haven’t been able to find a job no matter what degree they got. And there are a LOT of 50+ year olds in the group who are just plain tired of it all and fondly recall when things “truly were better.”
While the overall movement seems to be some what jumbled in it’s goals, it’s quickly becoming apparent that the biggest complaint is how much the “Government” no longer represents the “People,” but rather Corporations. Many are starting to believe that the repeated economic woes are directly tied to how Government continues to bow to Corporate Interests to the detriment of the Citizens.
They’re tired of corporate bail outs, massive tax breaks (and rebates,) for industries that are making record profits. They’re tired of being told “the wealthy need tax breaks as they’re job creators,” when all evidence and common business sense dictates that jobs are created when they’re needed, not because someone got a tax break and can “afford” to hire someone. They’re tired of excessive copyright and patent rules that stifle innovation. They’re tired of being told all their life “go to college, get a great job, live the American Dream,” but finding that there are no jobs, and they’re in debt for tens of thousands of dollars with no hopes of getting out of debt any time soon.
They’re tired of not being heard and represented by their elected officials.
The only thing keeping this from becoming a second American Revolution is these people still have hope that change IS possible. That Corporate needs must come in second to Citizens needs instead of the other way around. If that does not happen, the seeds of revolution that were cast into the wind of the Middle East will find roots again among the birthplace of Democracy.
You shouldn’t be worried about your commute home. You should be worried that things will continue the way they are.
Why Rick Perry would make a great President
Merely based on these stats;
Texas standings against all 50 states on a variety of issues (1st means highest ranking, 50th means lowest ranking).
• State Aid Per Pupil in Average Daily Attendance – 47th
• Scholastic Assessment Test (SAT) Scores – 45th
• % of Population 25 and Older with High School Diploma – 50th
• High School Graduation Rate – 43rd
• Per Capita State Spending on State Arts Agencies – 43rd
• Birth Rate – 2nd
• Percent of Uninsured Children – 1st
• Percent of Children Living in Poverty – 4th
• Percent of Population Uninsured – 1st
• Percent of Non-Elderly Uninsured – 1st
• Percent of Low Income Population Covered by Medicaid – 49th
• Percent of Population with Employer-Based Health Insurance – 48th
• Total Health Expenditures as % of the Gross State Product – 43rd
• Per Capita State Spending on Mental Health – 50th
• Per Capita State Spending on Medicaid – 49th
• Health Care Expenditures per Capita – 44th
• Physicians per Capita – 42nd
• Registered Nurses per Capita – 44th
• Average Monthly Women, Infant, and Children (WIC) Benefits per Person – 47th
• Percent of Population Who Visit the Dentist – 46th
• Overall Birth Rate – 2nd
• Teenage Birth Rate – 7th
• Births to Unmarried Mothers – 17th
• Percent of Women with Pre-Term Birth – 9th
• Percent of Non-Elderly Women with Health Insurance – 50th
• Rate of Women Aged 40+ Who Receive Mammograms – 40th
• Cervical Cancer Rate – 11th
• Percent of Women with High Blood Pressure – 16th
• Percent of Pregnant Women Receiving Prenatal Care in First Trimester – 50th
• Women’s Voter Registration – 45th
• Women’s Voter Turnout – 49th
• Percent of Women Living in Poverty – 6th
• Mortgage Debt as Percent of Home Value – 47th
• Foreclosure Rates – 10th
• Median Net Worth of Households – 47th
• Average Credit Score – 49th
• Retirement Plan Participation – 47th
• Amount of Carbon Dioxide Emissions – 1st
• Amount of Volatile Organic Compounds Released into Air – 1st
• Amount of Toxic Chemicals Released into Water – 1st
• Amount of Recognized Cancer-Causing Carcinogens Released into Air – 1st
• Amount of Hazardous Waste Generated – 1st
• Amount of Toxic Chemicals Released into Air – 5th
• Amount of Recognized Cancer-Causing Carcinogens Released into Water – 7th
• Number of Hazardous Waste Sites on National Priority List – 7th
• Consumption of Energy per Capita – 5th
• Workers’ Compensation Coverage – 50th
• Income Inequality Between the Rich and the Poor – 9th
• Income Inequality Between the Rich and the Middle Class – 5th
• Homeowner’s Insurance Affordability – 46th
• Number of Executions – 1st
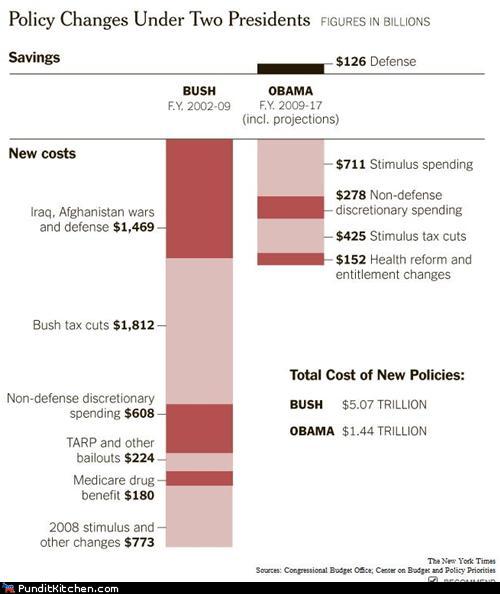
Cost of Obama’s Policies vs. Bush’s Policies

Source; Congressional Budget Office and Center on Budget and Policy Priorites